How much electricity are we using? A colleague of mine has made a simple circuit attached to an Arduino to answer that question. Furthermore my parents were also interested in monitoring their electricity usage. So I decided to introduce my father into the world of Arduino for his birthday.
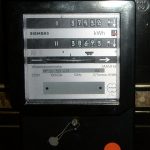
The electricity meter in the home of my parents is an old one that has a disc that rotates when electricity is being used. This disc is made of shiny metal, but there is a red line on it somewhere so that a human observer can keep track of the number of revolutions.
To track the revolutions with a circuit we used an infrared LED and an infrared receiver. The idea is that the infra-red light is reflected by the disc, except by the dark red line. The reflected light is received by the sensor and this way the Arduino can keep track of the number of revolutions.
Note that the infra-red sensor is sensitive to a certain frequency of infra-red light (36kHz in this case), this makes it insensitive to changes in the ambient light.
The resulting circuit looks something like this:
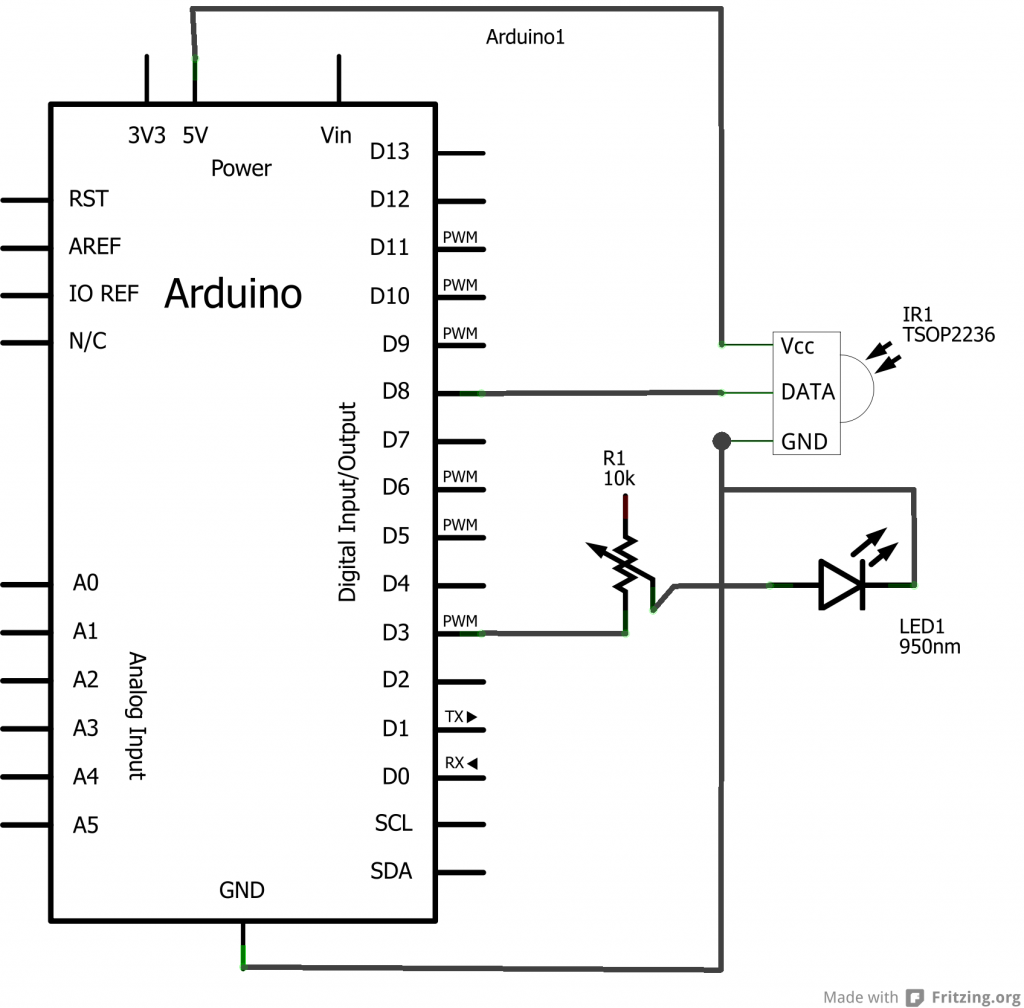
Though in our case we used an Arduino Ethernet so that it can store the usage on an SD card and my parents can check the usage on their smart-phone.
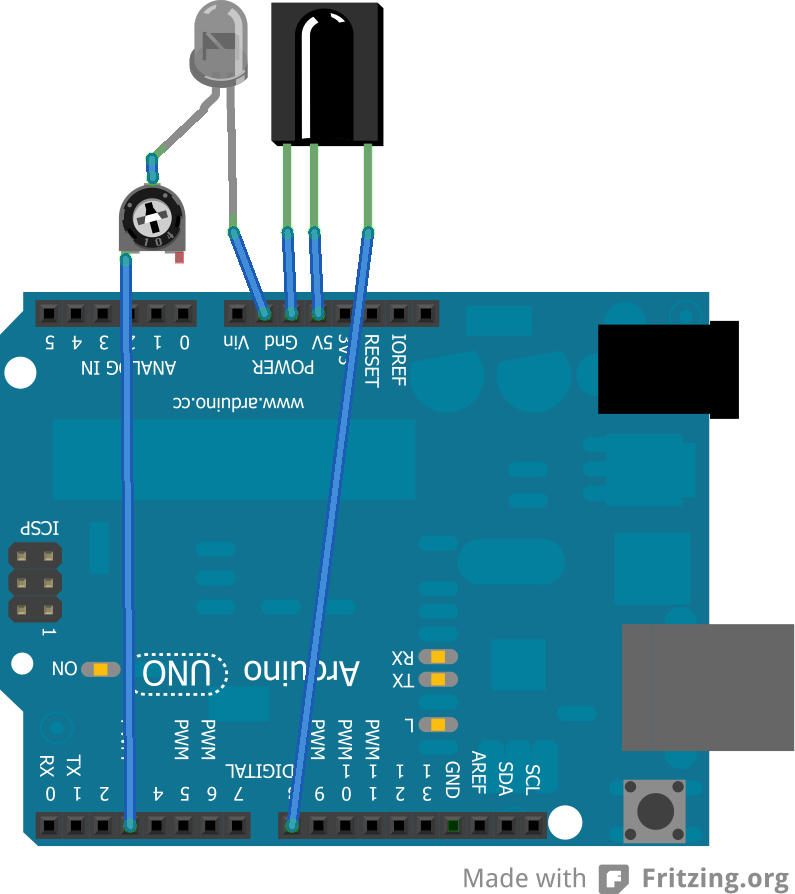
Note that the entire circuit is pretty compact and that it can be made by sticking the components directly in the Arduino and bending their pins, only a few cables are needed to connect the LED and sensor to pin 3 and 8 respectively. In fact my father and I managed to get the whole thing into an old clear plastic box for holding a cassette tape. We did have to make a hole in it though, because the plastic reflected to much IR light and made it impossible to read the electricity meter.
In the end we taped the whole box to the electricity meter. It took a bit of fiddling to get the led and sensor aligned to the disc, and them some turning of the potentiometer to tune the sensitivity; if the resistance is too low, the led will give off to much IR light and the sensor will react even when the red line on the disc crosses in front of it.
In the end the hardware components were relatively few:
- Arduino Ethernet
- Micro SD card
- IR led (950nm)
- IR receiver (TSOP2236, 36kHz)
- A 10kOhm potentiometer
The program for the Arduino and contents of the SD card are at the bottom of this post. Note that I used dutch terms in the program, since my father is more comfortable with his native language. The program does several things:
It configures pin 3 of the Arduino to give off an 36kHz signal, so the IR led will blink with the frequency for which the IR receiver is most sensitive.
It installs an interrupt service routine that reacts to any change on pin 8, i.e. the sensor. This interrupt routine then starts a timer that will trigger an other interrupt in a few milliseconds. If the sensor changes back to its old value before the timer expires, the change in sensor state is interpreted as noise, and the timer is stopped. So the sensor has to give a stable value for a few milliseconds before the value is used by the Arduino program.
The program interprets a change in the sensor as the passing of the red line on the disc. It knows that (in case of my parents meter) there are 187.5 revolutions per used kWh. So using the time since the last revolution it calculates the current power usage in Watts.
It also keeps track of the average number of Watts used during the last minute and writes this usage to a CSV file on the microSD card.
Additionally, the Arduino contains a web-server that allows access to the contents of the SD card, so that the CSV files can be retrieved and plotted in Excel. Furthermore the web-server is smart enough to replace parts of an HTML file with data from it’s memory, or files from the SD card. In effect any hash sign (#) followed by a number is replaced by something else. So I crafted an HTML file (in the ZIP file below) that is automatically filled with data, it also uses Google Charts to display the current power usage, and the usage from the past day in a graphical manner. Because Google charts are processed client-side, it off-loads the Arduino.
Oh, to have the Arduino write the data to SD with the correct time stamp, it also retrieves the current time from an NTP server. Originally I used the excellent Timezone library to convert the UTC time from NTP to the local time in the Netherlands. But with all the features in my program I was running out of program memory on the Arduino. So I wrote some dedicated functions for the conversion myself, which are a lot smaller, but can only handle the Amsterdam time zone.
There are still a ton of features I can think of and will probably add in the future, but this is it for now.
Some things I learned during this project:
Interrupt routines should be really fast, writing things to the serial port for debugging is not a good idea. If the timing messes up the communication between the processor and the SD card or ethernet chip, then all sorts of strange things can happen. And debugging that is a pain.
The Arduino ethernet library finds it necessary to pack each byte in a single network packet, creating an enormous overhead on the network. I’ve been experimenting to see if I can prevent this (there is some commented out code), but I have not added it to the program yet.
Knowing how much electricity is being used can be useful in unexpected ways. My father uses a 10kW electric heater when working in his garage during the winter. He noticed that only 8kW was being used, which alerted him to a problem. (In the end it turned out the problem was in one of the fuses for the three-phase power to the garage, but of course not before the whole electric heater had been taken apart and measured inside and out).